
Nvigorating
By Douglas Porter
February 23, 2024
Stocks rolled to new highs this week, perhaps best highlighted by Japan’s Nikkei finally surpassing its end-1989 peak. Putting those 34+ years into perspective, Britain has had eight different Prime Ministers, Canada six, the U.S. has also had six Presidents, and we’ve lost count of Japan’s leaders over that spell. Spurred on by Nvidia’s blowout earnings, the S&P 500 and Dow also reached new milestones, albeit with no change in world leaders since the prior records (hit last Thursday). The S&P is now up a cool 27% from a year ago, while the Nasdaq’s yearly rise is fast approaching 40%, and the Nikkei has even topped that mighty gain.
The furious rally in equities makes the Fed’s job even more complicated. Already frustrated by sticky services inflation, and a surprisingly healthy job market early in 2024, the heavy-duty loosening of financial conditions hardly calls out for the need for rate relief—on the contrary. This week’s FOMC Minutes noted the “risks of easing too quickly”, with some concerned that “progress on inflation could stall”. Fixed-income markets have absorbed the message, with Treasury yields backing up even further this week, rising to levels last seen nearly three months ago—or before the Powell Pivot. Market pricing of Fed rate cuts is leaning to fewer and further out, with even the June meeting now in some doubt, and little more than three cuts in total seen for the full year (we’re calling for four cuts, starting in July).
Aside from the Minutes, it was a particularly uneventful week on the U.S. economic data front. However, the light fare was still generally solid, with jobless claims falling anew to just 201,000—zero sign of stress there—and the S&P PMI showing a pick-up in manufacturing this month to its best reading since the fall of 2022 at 51.5. True, the leading indicator fell for the 23rd month in a row (basically since Fed hikes began), but the Conference Board opined that the index is out of recession range because more than half its underlying components have been on a rising trend over the past six months. We do expect growth to cool this year, and are holding at 2% GDP for Q1, but that’s from the piping hot 4% average pace in the second half of 2023.
The stock market sprint may revive broader consumer confidence, and could further support growth, in part through the wealth effect. Business capital spending may also be revved up by the equity rally, with M&E spending potentially following the strength already seen in factory construction over the past year. Note though that, so far, the AI boom has mostly been reflected in stock prices and only a narrow sliver of business outlays; over the past four years, overall business investment is up at a leisurely 2.7% annualized pace, a shadow of the double-digit gains seen in the late 1990s during the internet boom. Still, capital spending is supporting overall activity, and helping steer the economy away from a downturn. And GDP growth of around 2% is hardly cool enough to seriously weigh on underlying inflation, thus keeping Fed officials cautious.
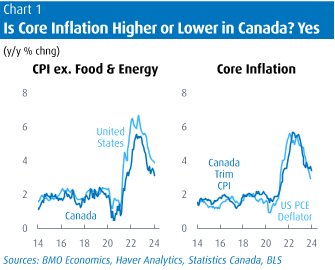
Canadian bond markets managed to buck the upward trend in yields this week, courtesy of a surprisingly friendly CPI reading. Running completely counter to the high-side surprise for U.S. prices, Canada reported a 0.1% drop in the seasonally adjusted measure, only the second decline since 2020. This carved the headline rate half a point to 2.9%, while the major core measures fell by 2-to-3 ticks. Ex. food & energy prices eased to 3.1% y/y, achingly close to the target range, and well below the 3.9% U.S. pace on the same basis. But, just to muddy matters, the core measures that the central banks track show precisely the opposite—the U.S. core PCE deflator is expected to ease to 2.8% in next week’s data, while the BoC’s median CPI is half a point higher at 3.3%. Life is complicated.
These diverging trends add to an ongoing debate since the possibility of rate cuts first came into view: Who would cut first, the Bank of Canada or the Fed? We have consistently leaned to the former, given the greater strain on the domestic economy from high rates, and a slightly cooler inflation backdrop. And the latest round of data supports that view, on both growth and inflation. Next Thursday’s National Accounts will likely reveal that Canadian GDP eked out a 1% rise in Q4, versus 3.3% U.S. growth in the same quarter. Still, the market is not fully convinced, with a June BoC cut also priced at just a bit above a 50/50 proposition. The lingering concern about early rate cuts in Canada is not so much about stoking a flaming equity market—no Nvidias in the TSX, sadly—but instead about fanning a simmering housing market.
A key feature of the latest Canadian inflation reading was that CPI excluding mortgage interest costs was precisely 2.0% y/y in January. More than one analyst swiftly pointed out that the Bank of Canada had thus achieved its target, since it was only its rate actions that were keeping headline inflation aloft. A modified version of that line is that the Bank should look through, or even ignore, mortgage interest costs (which are up 27.4% y/y, and the number one driver of inflation). There’s just one small problem with that line of reasoning: it ignores the fact that higher mortgage rates have also pushed down home prices, which are reflected in homeowners’ replacement costs (-1.6% y/y) and indirectly in other owned accommodation costs (+0.2% y/y). Together, these two items have more than double the weight of mortgage interest. Applying the CPI weights, the three combined generate a cost increase of 7.9% y/y, which happens to exactly mirror the increase in reported rents in the past year—and that seems entirely appropriate.
Recall that the U.S. CPI methodology for owned occupation costs essentially asks people what they believe they could rent their home for, and it’s up 6.2% y/y. That now almost exactly matches the rise in the actual rent component of the U.S. CPI (of 6.1%). The point being that while the mortgage interest component of the Canadian CPI looks astonishing in isolation, the end result in shelter seems entirely reasonable. Note that overall shelter costs in Canada’s CPI are up 6.2% y/y, in line with a 6.0% rise in the U.S. overall shelter component; and, since 2000, the U.S. is up at a 3.0% average rate versus 2.7% in Canada, even with the meltdown in prices in the former in 2007-2010. Here’s guessing that the average Canadian would argue that housing costs have risen a lot more than that since the start of the century, and probably a lot more than 6% in the past year. With rents still screeching higher and property taxes poised for a big step up in much of the country, strong gains in the Canadian shelter component are simply a reflection of reality.
Douglas Porter is chief economist and managing director, BMO Financial Group. His weekly Talking Points memo is published by Policy Online with permission from BMO.